
Roofing & reporting, united at last
Your work already lives in Roofr. Now your insights do too.
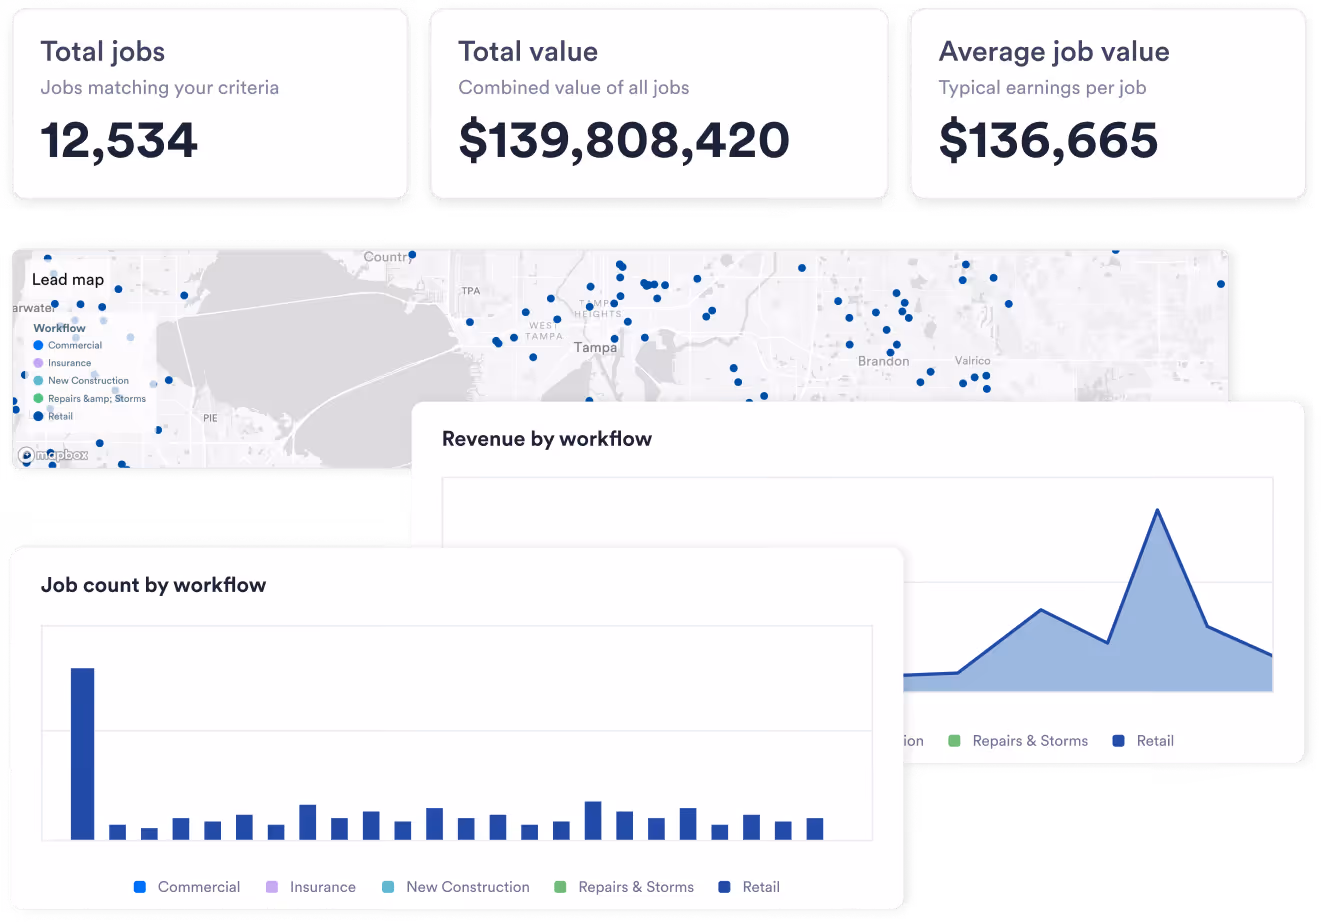
Show me the money
Questions this report helps answer
- Why did revenue spike this month?
- Which workflow closes the most jobs?
- How much value’s in the pipeline right now?
Stay in the lead
Lead Performance shows you how leads come in, are qualified, and get won. Review sources, conversion rates, response times, and more.
Questions this report helps answer
- What types of leads become won jobs?
- Which lead sources have the best ROI?
- Are my leads converting efficiently?


There’s no I in team
Is your team thriving, drowning, or right in between? Use the Team Performance board to compare close rates, job volume, and earned value across team members.
Questions this report helps answer
- Who are my top performers?
- Who needs help with their close rate?
- Is work shared evenly across the team?
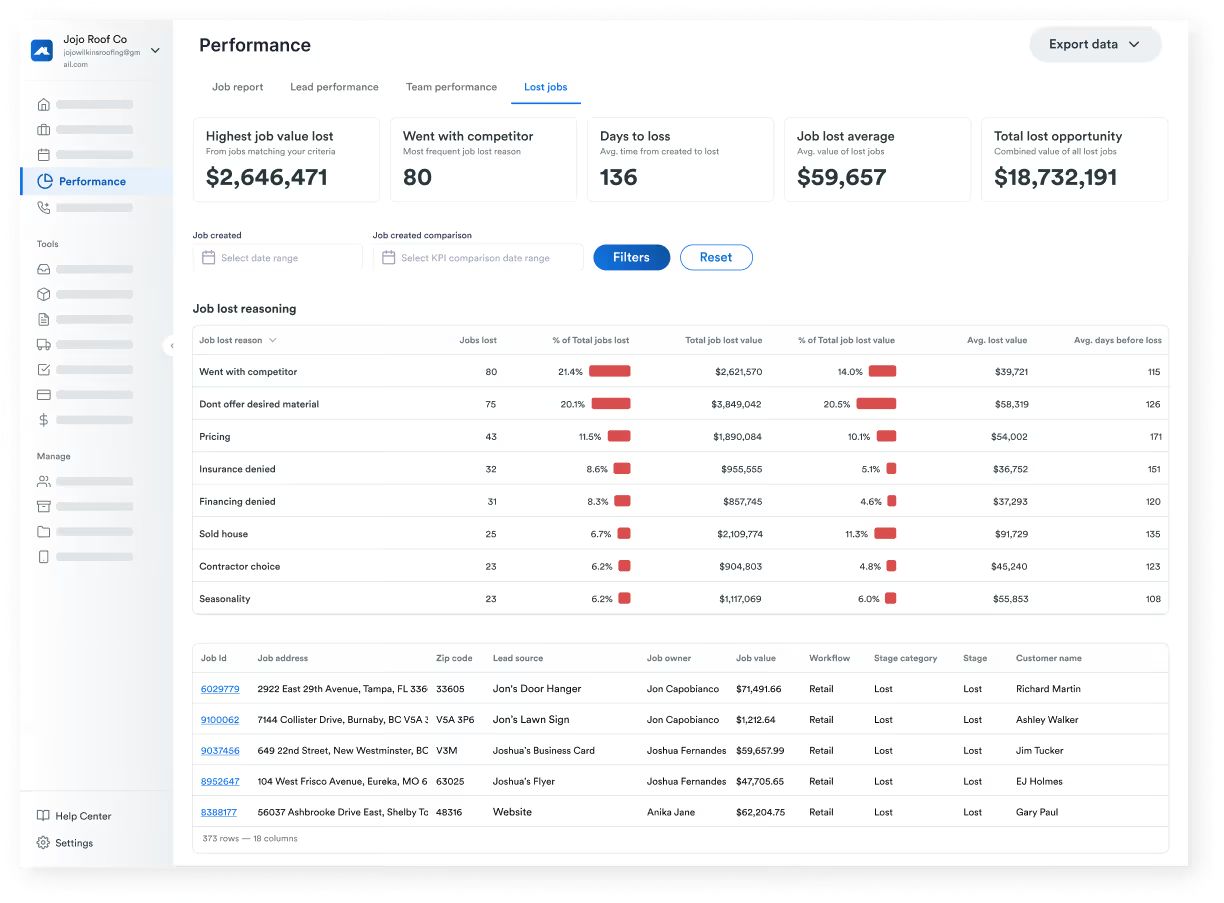
Get that close rate up
Every job lost is a chance to learn and improve. Lost Jobs highlights where leads are dropping so the team can avoid pitfalls, make improvements, and get ‘em next time.
Questions this report helps answer
- What’s the top reason we lose jobs?
- How much potential revenue did we lose in Q1?
- What changes could have the biggest impact?
Powerful reporting isn’t complicated
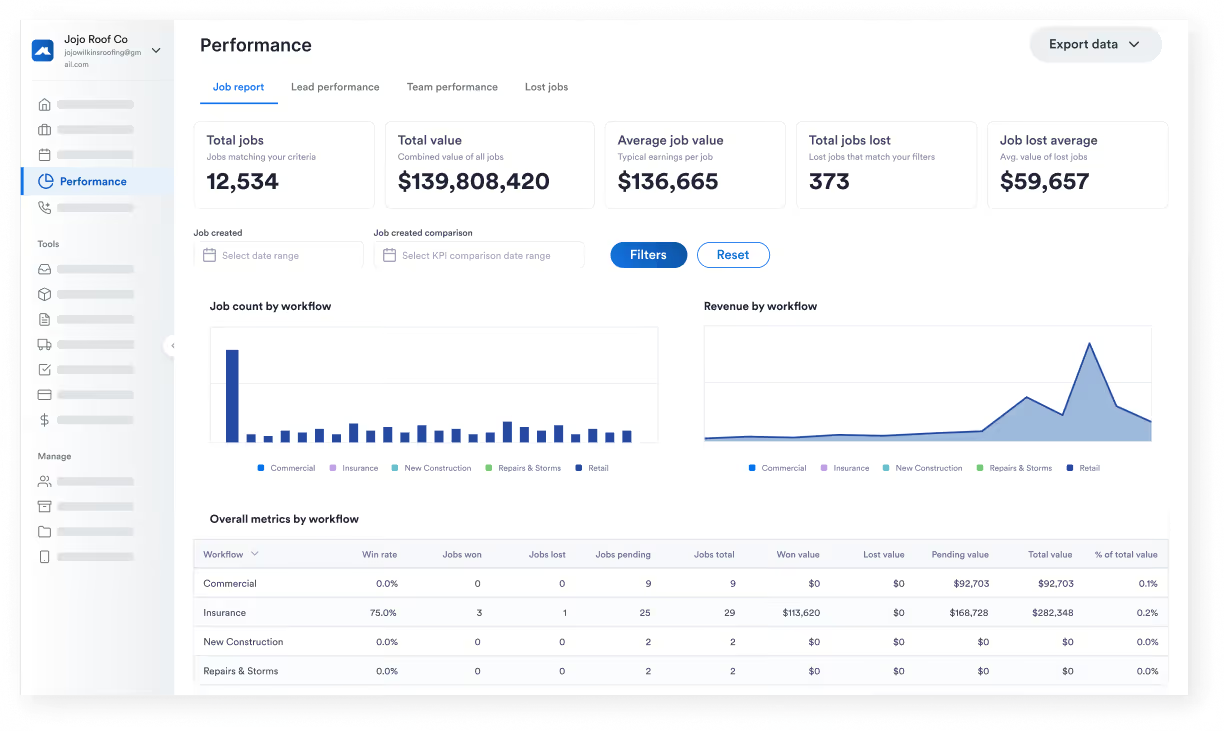
KPI summaries
See key metrics like jobs won, close rates, lost opportunity value, and revenue trends at the top of every report.
Flexible filtering
Filter by custom date ranges and business segments so you can analyze performance across specific time periods.
Built-in period comparisons
Quickly compare performance against previous periods to understand how key metrics have changed.
Interactive charts
Click to drill down on individual jobs, leads, or crews directly from high-level charts and tables.
Real-time reporting
Dashboards pull data from your Roofr workflows as they happen, so reports always reflect the latest.
Data export
Export your data with a click whenever you want to play with the numbers or plug them in elsewhere.
Turn insights into action

Understand your business
Use Performance Dashboards to see how your revenue, leads, team goals, and lost jobs are trending.

See ways to improve
Analyze lead sources, pipeline performance, and lost jobs to know exactly what to focus on.

Evolve your workflow
Reporting lives in Roofr with your leads, sales, and jobs, so you can go from insight to action right away.
FAQs
You have questions, we have answers. Here’s our most frequently asked questions.
There are four report types in total: Job Performance, Lead Performance, Team Performance, and Lost Jobs.
Yes. The new dashboards replace the legacy reporting experience with clearer reporting and improved filtering.
Absolutely. Filter reports by custom date ranges to analyze performance across any time period.
You bet. Dashboards pull directly from your Roofr workflows, so reports reflect the latest activity in your business.
Yep. From any chart or table, you can click through to explore the job, lead, or activity data behind each metric.
Close Rate = Won Leads ÷ All Leads.
Qualified Close Rate = Won Leads ÷ All Qualified Leads. This metric excludes any early unqualified and lost leads.
Not currently. To keep Performance Dashboard metrics consistent, formulas are standardized and can’t be edited by users.
For now, reports are fixed as they are. You can filter the data and set date ranges, but otherwise, custom chart types, layouts, and visualizations aren’t supported (yet).
Performance Dashboards are made for owners, managers, and team leaders who need a clearer understanding of business performance.
